Loggers
A logger is a diagnostic tool that allows developers to output data from a running program over time and then archive it. This allows a post-script characterization of how the program, in this case your game, has run. Loggers often support a type of tagging, where events with specific qualities are marked and individually monitored. Tagged events are then either outputted to individual files or set up with some sort of viewing client to parse the data. This type of sorted run-time information can give detailed insight into how a game performed.
Logger Usage
By way of example, a logger could be designed to monitor non-critical errors over the course of a play test. These errors could be tagged with different severities or other game-state information from the time of their occurrence. By inspecting the logged outputs after play, a developer could gain crucial information about the number and distribution of errors across an entire session. This offers a different viewpoint than the more typical diagnostic approach of witnessing a single error, then moving to fix it immediately. Another illustrative example of data logging is shown below.
 APM Logged in a Replay Visualized with Scelight
This chart is a visualization of the APM of a StarCraft player over the course of a multiplayer match. APM has been logged every few seconds, then graphed to give a smooth picture of it as a piece of data over a game session. The data is derived from a StarCraft replay. Replays themselves are the output of a logger that records every player action during a match.
It may seem like a bit of a stretch to see this as relevant to the article at hand. After all, replays are targeted at rebuilding a match of a completed game as it occurs, while a logger usually monitors how a program performs. Still, this should be a familiar example for StarCraft users despite how elaborate it is. After all, replays are recorded for any online play tests of a game and can offer a useful picture of what occurred during that test. Replay analyzers, like Scelight in this case, offer an example of a client that parses tagged output data.
Creating A Logger Within The Editor
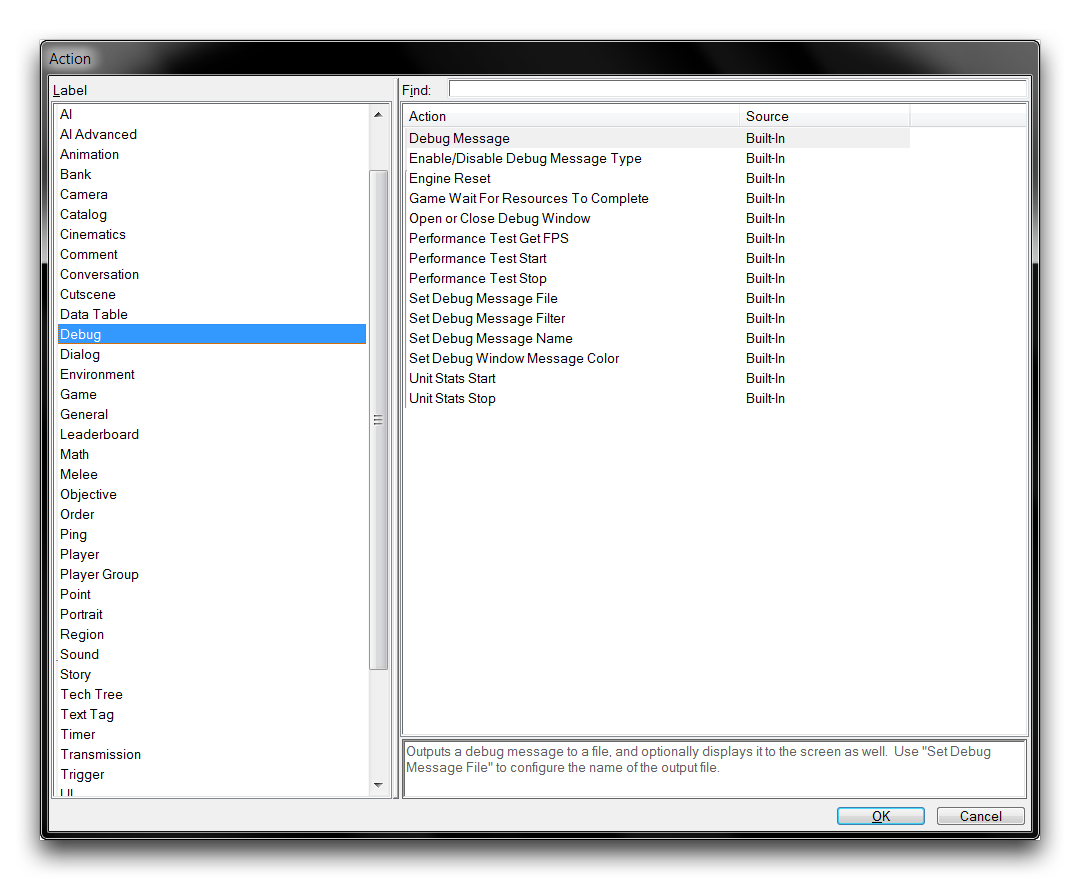
Assembling a logger directly within the StarCraft engine is both possible and potentially useful for the development of your project. To do so, there are a couple of specifications to meet. First, there must be a way to output debug information at any given location within the code. This information must then be able pass out of the Editor and into a file structure, where it is separated into several files based on logging tags. Having a global control for the debug process to quickly enable and disable logging would be useful as well. With this design in mind, you can shape a logger from existing functionality in the Editor. In terms of output options, the ‘Debug’ actions are a good place to start. A list of these actions is shown below.
 Debug Actions
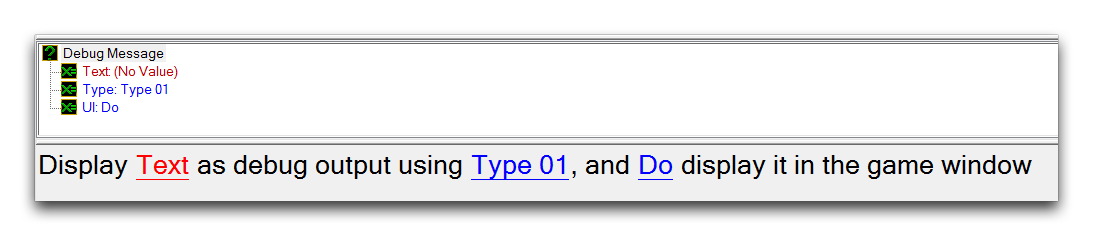
The first point of interest here is the action Debug Message. This allows text to be printed to either a file, game window, or the Trigger Debugger. Select this action and move into the Trigger Editor. There you’ll note that its parameters are an ideal fit for logger design. You can see them in the image below.
 Debug Message Parameters
The initial parameter sets the output text, while the second parameter allows you to specify a Debug Message Type. This is a preset with 16 potential values, Type 01 through Type 16, that can serve as tags for the output. Once tagged, you can configure each output type to print to different files and exhibit different behaviors with respect to what it outputs and how it presents those outputs. For this demo, you’ll use three tags, with each being modelled as a different error severity level. To keep track of these tags, they have each been set to a constant variable. The full mapping follows the scheme below.
logger_info = Type 01 \<Debug Message Type(Constant)>
logger_warning = Type 02 \<Debug Message Type(Constant)>
logger_error = Type 03 \<Debug Message Type(Constant)>
With these set, the logger trigger can be developed using the following plan.
 Debug Triggers
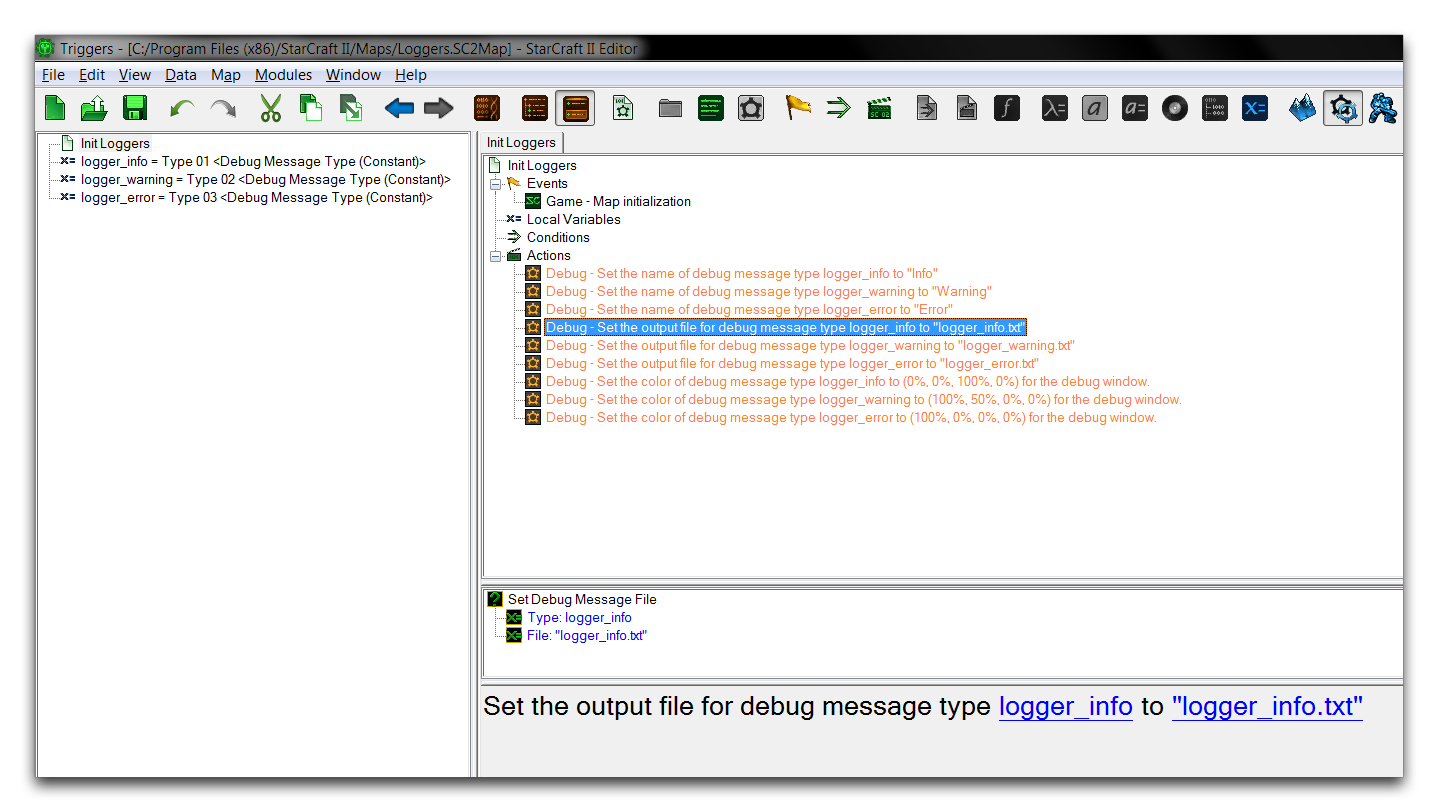
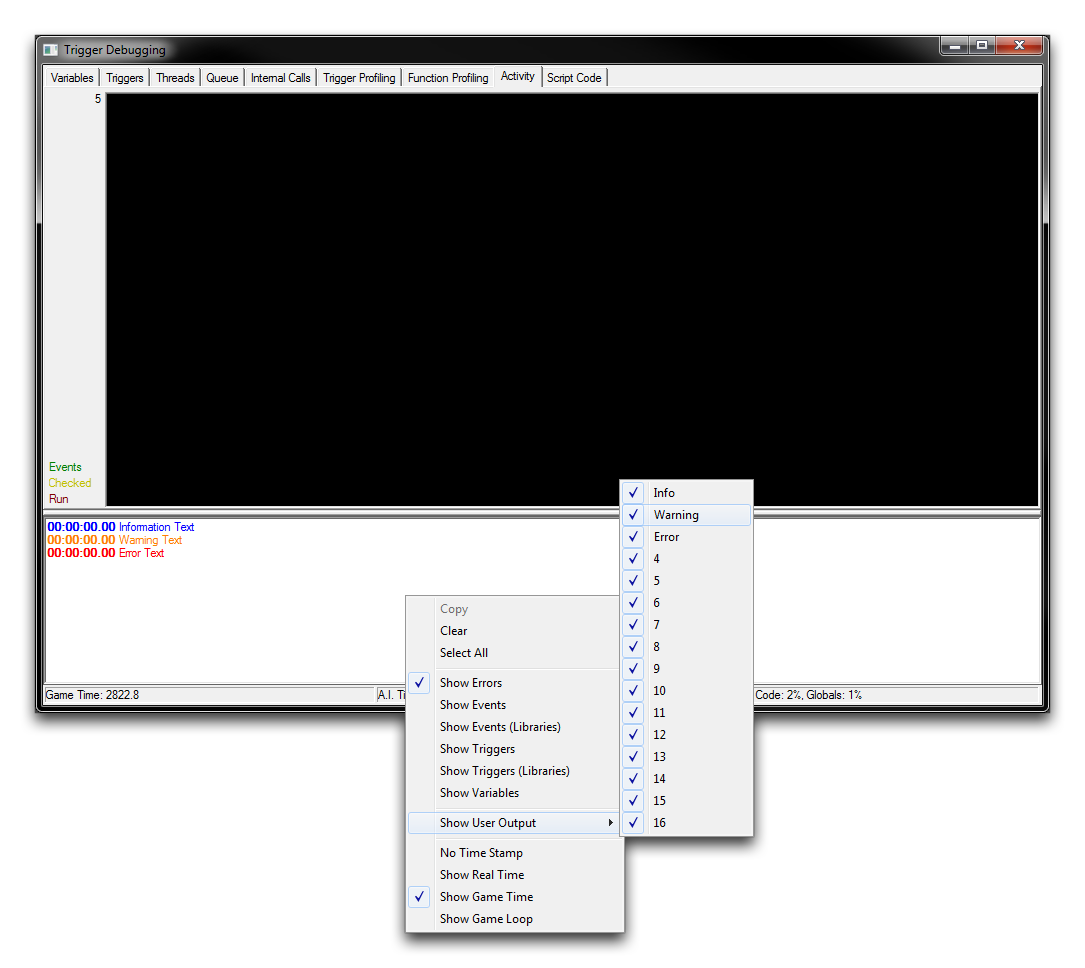
By using the Set Debug Message Name action, you can assign a custom name to each of the specified debug message types. This name appears in the Show User Input option available from the Trigger Debugger and makes it easier to handle the different output channels. This is supported by the Set Debug Message Color action, which will allow you to differentiate more easily when looking at the debugger window. You can see this in the image below.
 Debug Triggers
Then, most importantly, the Set Debug Message File allows for the assignment of file names to each of the debug message types. It is recommended that you assign a unique file to every logging level. Doing so will allow this trigger to serve as a full logger by delineating the error types into separate files for inspection after a test. For single player games, the output folder for logger files on Windows will be C:\Users\\<username>\Documents\StarCraft II\UserLogs\\<mapname>.
 Logger Output Files
Adding Filters
At this point the logger is operational and can output potentially useful diagnostic data to separate files. It meets the design criteria. However, you might want to filter debugging messages one level further. There are some more functions which can help here. Enable/Disable Debug Message Type allows you to toggle each specific debug message type within the Trigger Debugger. This filter is only for viewing though, it will have no effect on the in-game readout or the output files. If you’d like to filter the in-game readout and output files, you can use the action Filter Debug Message Type.
Unfortunately, there is no way to disable messages only in the Trigger Debugger. One workaround is to use the third parameter of the Debug Message action to disable these outputs. If you are implementing your own logger, it may be a good idea to encapsulate the Debug Message inside an action definition to permanently build in this ability yourself.
As a final note, when you’re creating a release version of your project for the public, these debug filters can be used to quickly disable every debug output and maximize the performance of your release version.